
Earlier this year, we examined whether there is a connection between the raw scores recorded in the Year 4 Multiplication Tables Check (MTC) and scaled scores recorded two years later in the key stage 2 Maths SATs. We concluded that the most we can say is that, at population level, lower scores on the MTC (or in KS2 Maths) appear to be related to lower scores in KS2 Maths (or the MTC).
We reported that ‘the nature of the MTC means that it has very little predictive power for the majority of pupils. Those who struggle with times tables knowledge also struggle with maths more generally’.
A reader got in touch to ask us about the difference in the distributions of KS2 Maths scores for each of the scores on the MTC. Their question was whether the time some schools spend on drilling multiplication facts is worth the effort.
In short, does improving MTC scores improve KS2 SATs outcomes?
To explore this question, we began by looking at the distributions of KS2 Scores in 2024.
Firstly, here is the distribution of 75,631 pupils whose scores on the 2022 MTC and 2024 KS2 Maths are recorded in Insight.
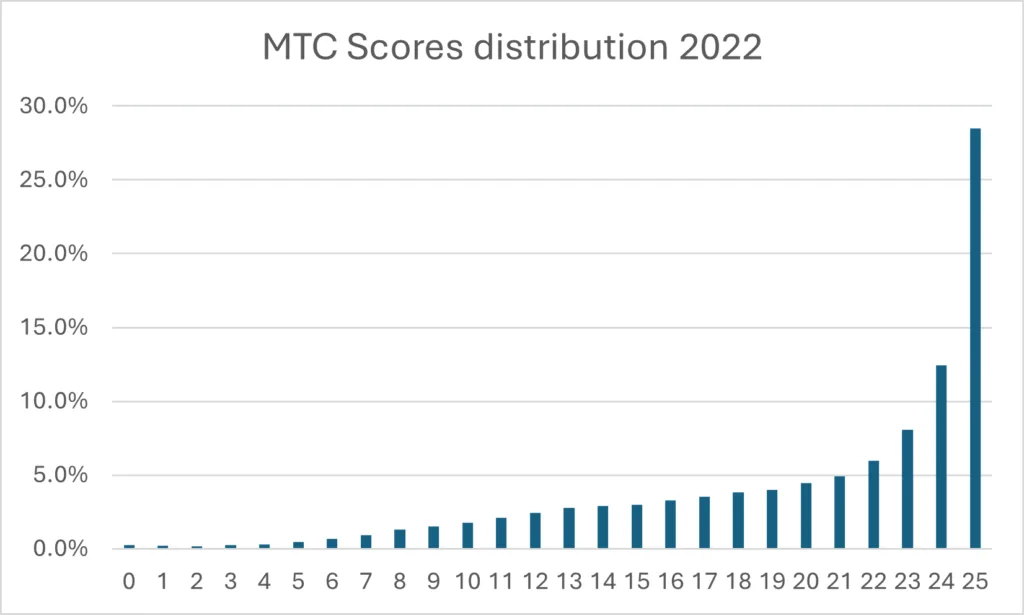
As we noted in our earlier blog, over 50% of candidates scored the top four possible scores, with 28% of our sample achieving full marks. This is in line with the national average of 27% in 2022. The median score of our sample was 22 and the mean score was 20.1. Across our whole sample, pupils were awarded the following KS2 Maths Scaled Scores.
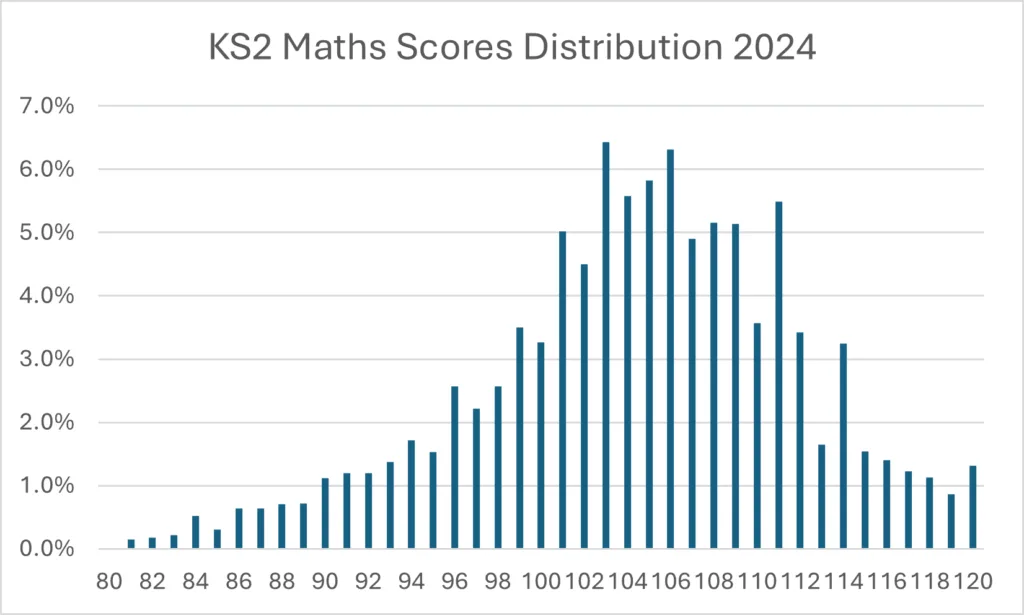
The Expected Standard for KS2 Maths is 100 or more. Those scoring 110 or more are designated working at the Higher Standard. We used these groupings to analyse outcomes for both our whole sample and each MTC score they recorded.
The outcomes for our whole sample were as follows:
| 110+ | 24.8% |
| 100 to 109 | 51.2% |
| <100 | 24% |
| 100+ | 76% |
When we look at the top four MTC scores (22, 23, 24, 25) we see the following distributions at KS2:
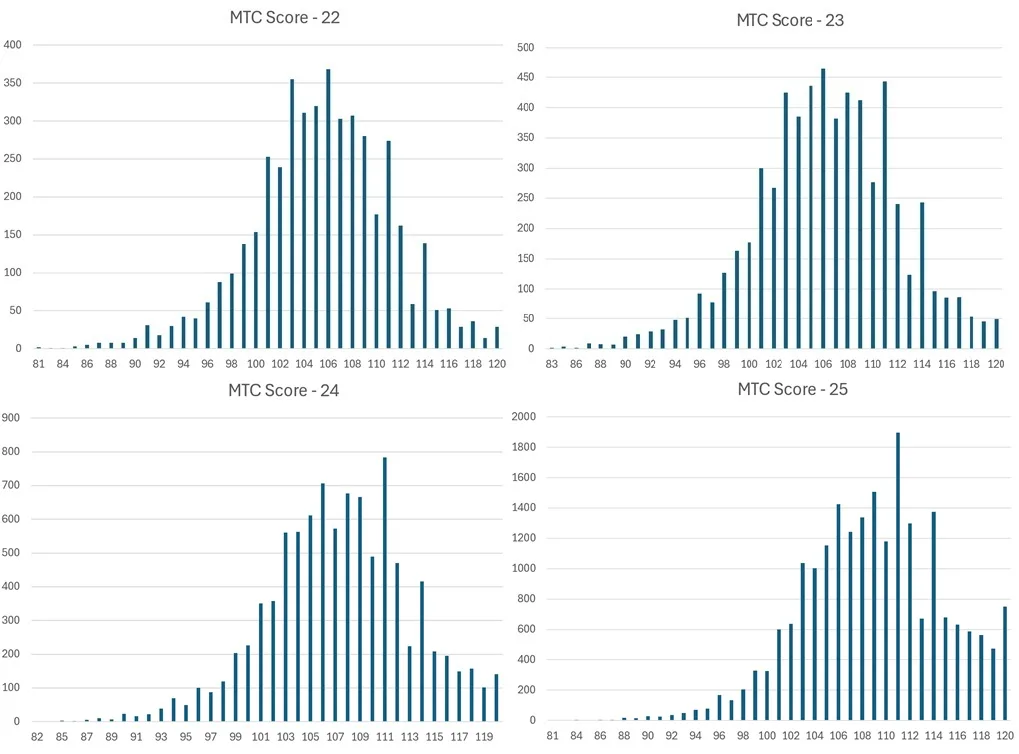
These distributions show that for each prior MTC score, pupils recorded most of the possible KS2 Maths outcomes. Between 22 and 24 marks, the percentage of pupils recording 110+ increases by around seven percentage points for each additional mark. For pupils scoring 25 rather than 24 on the MTC, there is an 11 percentage point increase in those achieving the Higher Standard at KS2, although it should be noted that this group includes a noticeable number of pupils clearly working above the level of both MTC and KS2 Maths (scoring maximum marks on each).
| 22 | 23 | 24 | 25 | |
| 110+ | 22.7% | 28.5% | 35.5% | 46.9% |
| 100-109 | 64.1% | 60.1% | 56.4% | 47.6% |
| <100 | 13.3% | 11.4% | 8.1% | 5.54% |
| 100+ | 86.7% | 88.6% | 91.2% | 94.46% |
The number of pupils scoring 100+ increases as pupils score more on the MTC, but only by a few percentage points for each additional mark.
Pupils in the Higher Standard category at KS2 tend to have the highest MTC scores, but for each additional mark above 22, there is no huge impact in the numbers achieving the Expected Standard. This does bring into question the benefit of spending curriculum time to improve MTC scores for the highest attaining pupils as it is unlikely to result in noticeable gains at KS2.
Leave a Reply