
School performance measures are fairly clumsy, especially when it comes to attainment. We compare this percentage to that percentage and react accordingly. If the school number is bigger than the national number, we’re happy, but if it’s the other way round, then we start to worry what the governors and Ofsted are going to say. In a secondary school, with 200 or more pupils in each year group, percentages have some validity, but in an average-sized – i.e. one form entry – primary school where each pupil accounts for 3% of the cohort’s result, percentages start become somewhat noisy.
This is particularly problematic in data presented in the school performance tables and the Analyse School Performance (ASP) system where statistical tests are only applied to progress measures. Attainment – the percentage of pupils reaching a particular threshold – is uncategorised, and the audience are left to make up their own minds without guidance.
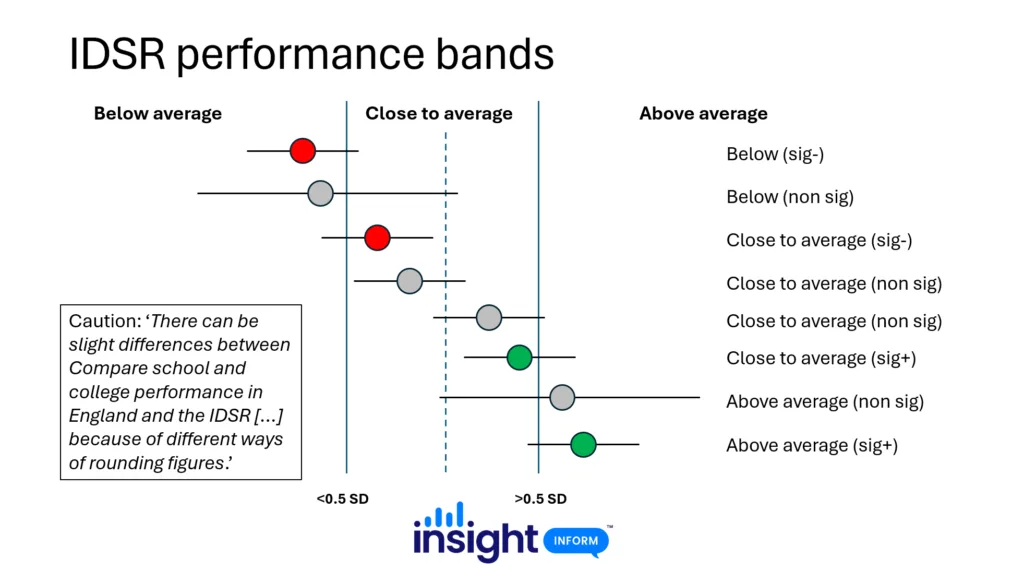
The new IDSR takes a different – two-layered – approach to categorising a school’s results. First it applies a broad filter to place the outcome into one of three bands:
- Below average: more than 0.5 standard deviation below national average
- Close to average: within 0.5 standard deviation of national average
- Above average: more than 0.5 standard deviation above national average
A confidence interval is then applied to determine whether the result is statistically significantly above or below national average. If the interval includes the national average then the result is deemed to be statistically in line; if the interval does not include the national average then it is either significantly above or below. This does, however, result in some rather odd and confusing categories, as shown in the following diagram:
This is all rather abstract and many people understandably struggle to make sense of the information, which is why it’s worth converting gaps – the difference between two percentages – into the equivalent number of pupils. As mentioned above, in the average primary school with 30 children in a cohort, each pupil accounts for 3% of the outcome. In this scenario, a school result that is 10 percentage points below the national average equates to three pupils. In other words, three more pupils achieving the expected standard in, say, phonics, would close the gap to the national figure. A 10 percentage point gap for any cohort with fewer than 10 pupils is meaningless because it doesn’t equate to single pupil in real terms. Most of us feel we’re on safer ground when we are talking about actual pupils instead of standard deviations and confidence intervals.
There is an interesting example in the disadvantaged gap section of the example IDSR, which perfectly illustrates the need to convert percentage gaps into the equivalent number of pupils.
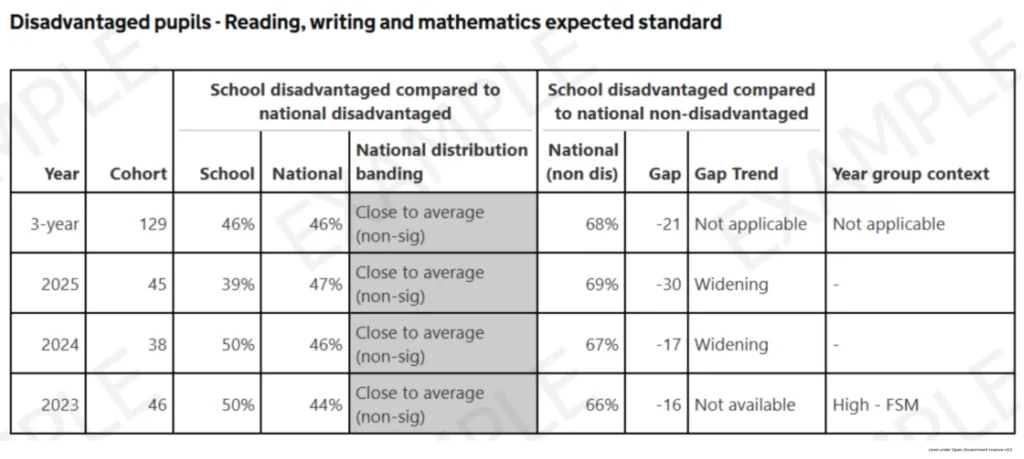
Here, the school percentage of disadvantaged pupils achieving the expected standard is compared to the percentage of non-disadvantaged pupils that achieved the same standard nationally. If the school figure is higher than the national figure, then ‘Positive gap’ will be stated in the gap trend column. If the school figure is equal to the national figure, then ‘No gap’ will be shown. Otherwise, where the school figure is below the national average, the gap column will contain a negative figure, which will be classified as either ‘Widening’ or ‘Narrowing’ depending on how it compares to the previous year’s gap. Note that data is suppressed if there are fewer than six disadvantaged pupils.
The appearance of the term ‘Widening’ in the gap trend column is quite alarming, but we have to bear in mind that it is based on a purely numerical comparison. In 2023, the gap was -16 (i.e. 16 percentage points below national) and in 2024 the gap had widened to -17 (i.e. 17 percentage points below national).
But what do these gaps mean in real terms?
To do this, simply take the gap figure and work out that percentage of the school disadvantage cohort:
- 2023: 16% of 46 pupils = 7 pupils (7.36 rounded down)
- 2024: 17% of 38 pupils = 6 pupils (6.46 rounded down)
This means that the 2024 gap has widened compared to 2023 in pure numerical terms, but in terms of the number of pupils the gap equates to, it has narrowed. In 2023, the school would require seven more disadvantaged pupils to achieve the expected standard to close the gap to national. In 2024, they would require six.
If you are trying to make sense of your IDSR or any other source of data where percentages of pupils are compared to national figures, it is well worth converting gaps into the equivalent number of pupils. Sometimes it can completely change a narrative.
Insight are back on the road –
have a look at our latest events here.
Leave a Reply