
Teacher assessment data tends to fall into one of two camps: absolute and relative. Here, the term ‘absolute’ refers to data that sits on a sequential, often numerical, scale that pupils tend to move along over time, and where each increment represents a certain point in the curriculum and a certain amount of curriculum knowledge secured. ‘Relative’, on the other hand, describes the pupil’s position in comparison to a standard or average, which they may be below, in line with, or above.
Everyday examples include your height in centimeters (absolute) versus how it compares to the national average (relative); or how long it takes to drive somewhere in minutes (absolute) versus a comparison between the actual and the estimated journey time (relative). In education, levels and GCSE grades are examples of absolute data whereas common approaches to teacher assessment in primary schools – working below, towards, within, and above expectations – are relative in nature. It should be noted that I am using the term ‘absolute’ here somewhat loosely to describe an incremental scale. Unlike height or time*, there is no meaningful zero in education – we could never say that child at level 4 knew twice as much a child at level 2; a child that scores 0/20 on a test cannot be said to know nothing.
When levels were removed a decade ago, most schools, LAs, and suppliers of tracking systems set about recreating them. Levels were replaced by a new number that represented the year the pupil was working in, and this sat alongside an additional unit of information – commonly ‘Emerging’, ‘Developing’, and ‘Secure’ (E/D/S) – which denoted the coverage of that year’s curriculum. 2B became 2S, pupils still followed a flightpath and made the magic three steps per year, and everyone was happy.
But over time most schools became disillusioned with a system that recreated all the problems of the old one – linear progression flightpaths that bore no relation to reality – and started to adopt relative assessment approaches instead. These described children in terms of how they compared to a ‘point in time’ standard rather than their position along an incremental scale:
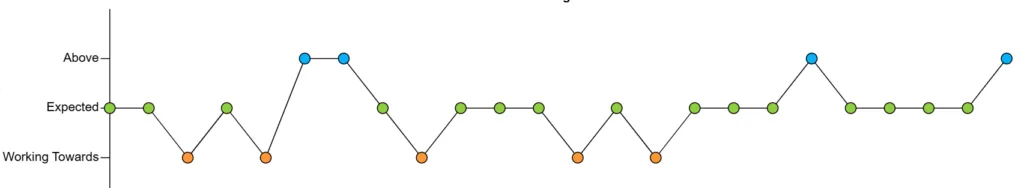
- “How does this child compare to where I expect them to be right now?”
- “Are they below, at, or above current curriculum expectations?”
- “Are they likely to meet expected standards at the end of the year or key stage?”
Teacher assessment therefore became descriptive – more qualitative and less quantitative – which is a good thing. The humans brain is good at making broad comparisons; it is less capable of making accurate measurements. But scales like levels gave the impression of accuracy, which led us to believe we could subtract one ‘measurement’ from another and the result would be a reliable measure of progress. This was an illusion.
For those schools that have switched from absolute to relative approaches to capturing teacher assessment there is, however, a sticking point: SEND. Or, more specifically, those pupils that are working below the age-intended curriculum. Describing pupils as working towards, within, and above expectations seems appropriate and is suitable for reporting to parents. But recording pupils as working below expectations is depressing and doesn’t capture the progress they are making – teachers understandably want the data to demonstrate the pupil’s ‘small steps of progress’.
Unfortunately this desire to accommodate the progress of pupils working below has caused some schools to attempt to hybridise absolute and relative assessment approaches – combining incompatible approaches into a single scale. One part of the scale – that part intended for those working broadly within age-related expectations – is relative; the lower part of the scale – that intended to show the progress of pupils working below expectations – is absolute. An example is as follows:
- Above
- Expected
- Working Towards
- Y5S
- Y5D
- Y5E
- Y4S
- Y4D
- Y4E
- Etc
Clearly this can’t work. In the lower part of the scale, pupils are expected to move up; in the upper part of the scale, pupils are most likely to remain in the same band. For most pupils ‘expected progress’ is a value-added-style 0; for those working below, it’s an increment per term. It attempts to merge fundamentally different approaches to recording assessment data, which is the assessment equivalent of mixing oil and water. A better approach is to separate them out – for pupils working below, record an additional teacher assessment that shows the curriculum year the pupil is working in and how securely they are working in it. And don’t forget appropriate forms of standardised assessment that can more accurately measure the attainment and progress of pupils with SEND.
Insight Schools: you can book a call to discuss the issues raised in this post via the Help > Insight Inform Data Surgery
Further reading: Tracking the progress of pupils with SEND
* Yes, I know time is relative but let’s assume we all live on the Earth’s surface.
Leave a Reply