

What does a Similar Schools measure tell us about Primary Schools?
Schools in England last had a method of comparing their published outcomes data to those of schools with similar contexts in 2010. This was the last year the Department for Education published its Contextual Value Added data which it introduced in 2005/6. This measure attempted to take into account factors which, at a national scale, are understood to have a bearing on pupils’ academic outcomes.
CVA was removed by the incoming government in 2010, which argued that the analysis was too complex, too difficult for parents to understand and that it lowered the expectations for some pupils and schools.
From 2010 to 2025, school outcomes were compared to national attainment and progress outcomes alone1. This did not take a school’s context into account.
From September 2026, a new Similar Schools measure has been included within schools’ Inspection Data Summary Reports (IDSRs). This aims to ‘identify groups of similar schools to support the interpretation of pupil attainment data with similar contexts2’.
You can see a section of the example IDSRs which include this new data (available here) below. The ‘Versus similar schools average’ section is new and did not appear in 2025/26 IDSRs.
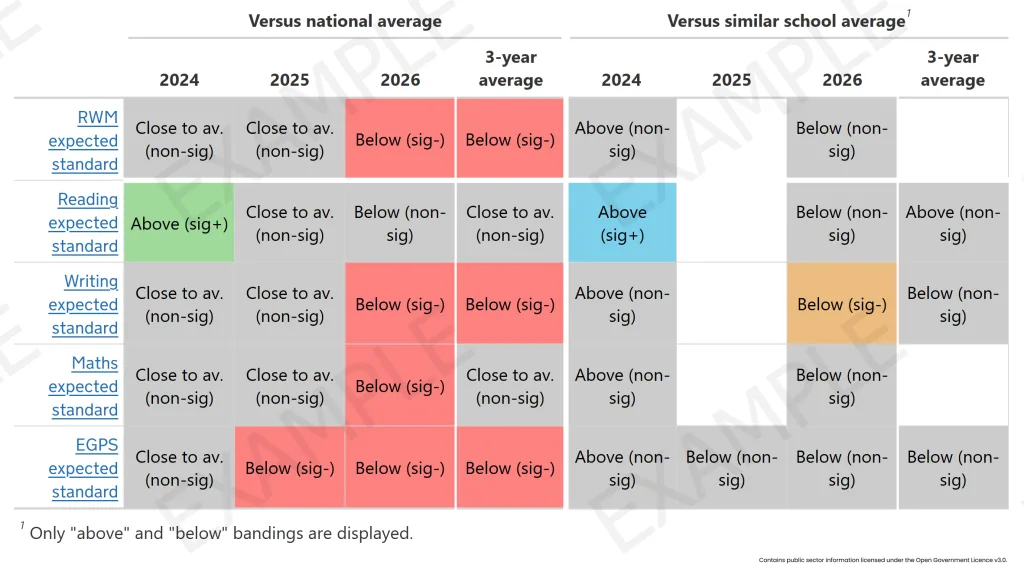
It should be noted that the Similar Schools model uses the same colour coding – blue for ‘Well above average’, orange for ‘Well below average’ – as its School Characteristics in the Context of the school section of the IDSR, rather than the green and red of the Achievement section.
It should also be noted that the Similar Schools data does not include the grey colouring used in the ‘Versus national average’ charts for data which is ‘close to average’. This explains the empty boxes on the right hand side above.
Why introduce a Similar Schools model?
The DfE’s explanation for introducing the Similar Schools measure is as follows:
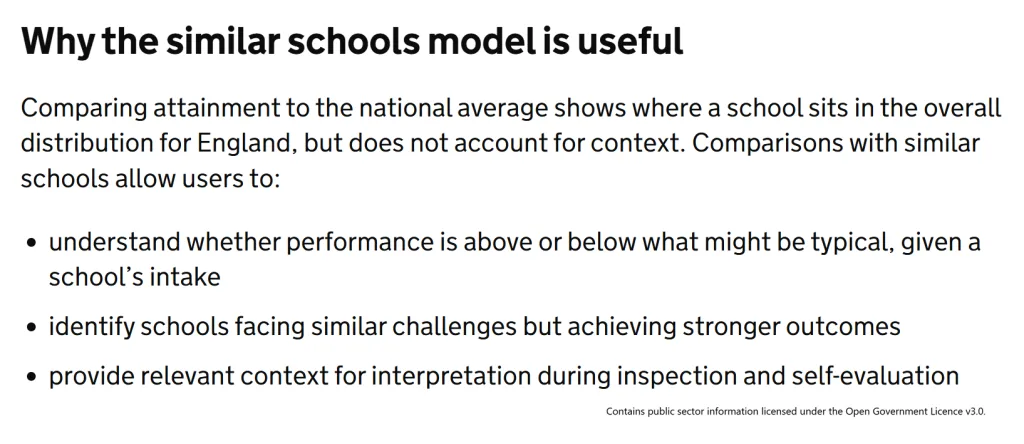
This is a notable change from the position from 2010 to August 2026. As noted above, in this period, schools were only compared to the national average. The question the DfE has posed has, since 2010, been, ‘how does a given school’s published data compare to the national picture?’. The question which the Similar Schools measure asks is, ‘how does a given school’s published data compare with schools educating similar pupils?’.
What factors are included in the Similar Schools model?
As the technical note explaining the model indicates, the Similar Schools model uses a number of data points which the DfE’s analysis suggests predict pupil attainment in key stage 2 (KS2) reading, writing and maths.
These nine data points, and the weighting the DfE uses in its model, are shown below.
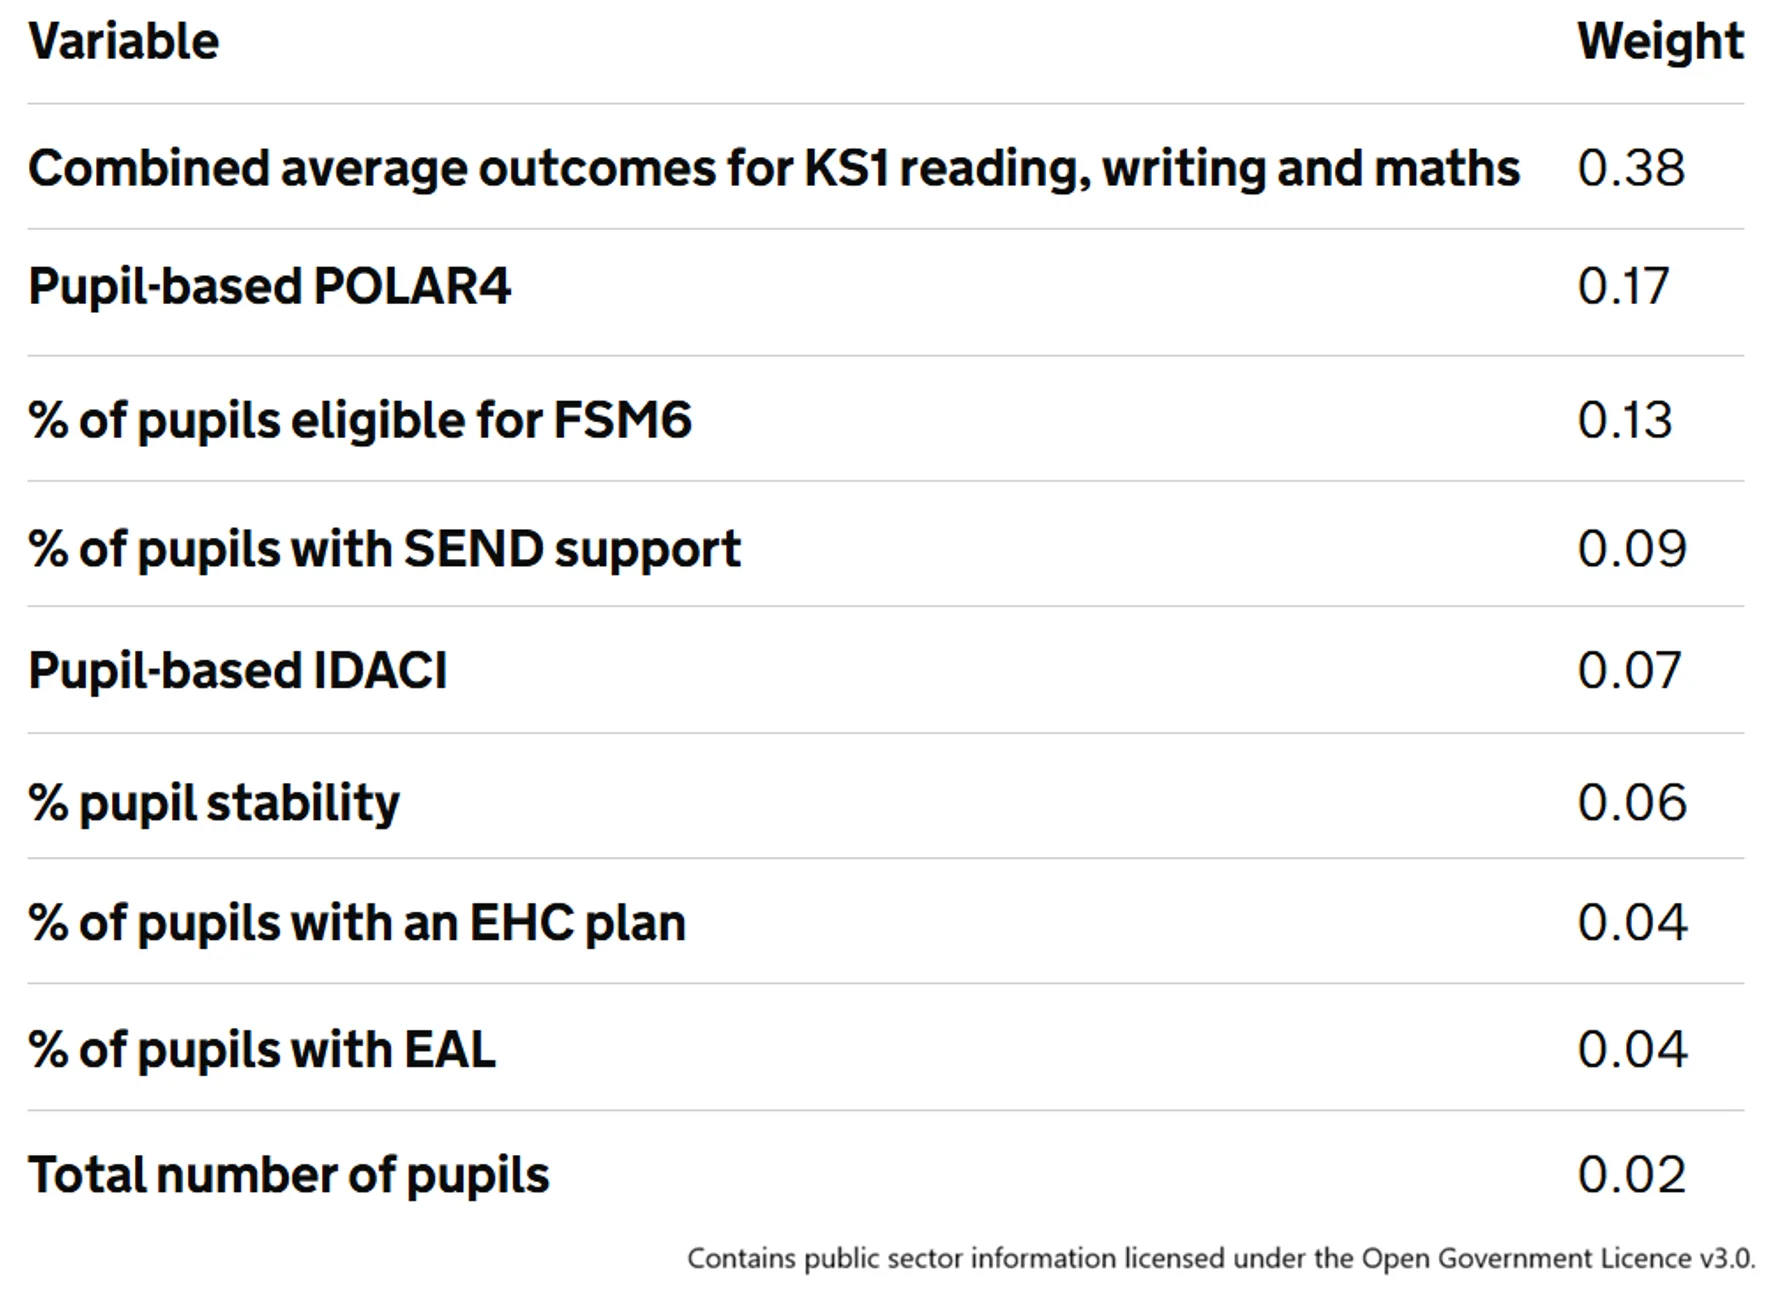
These data points are selected because they are deemed to be largely out of the school’s direct control. This is to guard against any potential gaming of the data. The model uses data for all the pupils in a primary school (where it exists) rather than data for just those in the year group taking KS2 SATs.
It should also be noted that, for the current model based on 2025/26 data, the combined average outcomes for KS1 reading, writing and maths were only available for the pupils who were in Years 5 and 6 last year. This is because there is no KS1 data for the pupils in Year 3 or Year 4 in 2025/26 (because KS1 assessments were discontinued in 2023/24).
In 2026/27, the primary model will therefore only have prior attainment for Year 6, as there is no KS1 data for Years 3 to 5.
Those in schools are likely to be familiar with IDACI data (the government’s Income Deprivation Affecting Children Index, which uses the proportion of children aged 0 – 15 living in income-deprived families in a local area). POLAR4 data is the fourth iteration of POLAR (‘participation of local areas’) data. It classifies local areas into five groups based on the proportion of young people who enter higher education aged 18 or 19 years old.
Prior attainment (KS1 scores) constitutes 38% of the model’s data. Measures of disadvantage (IDACI, POLAR4 and FSM6) constitute 37% of the data used in the model. SEND measures account for 13%, with EAL, Stability and number of pupils the final 12%.
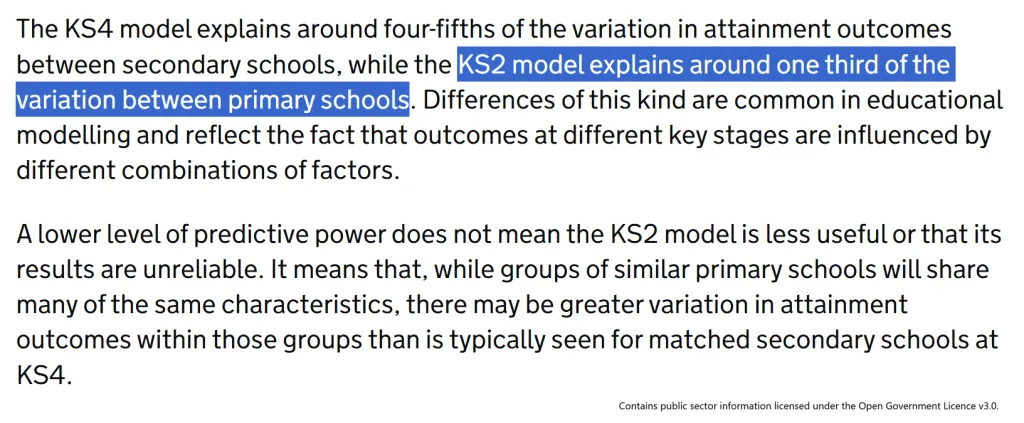
The difference between the power of the secondary model compared to the primary model is stark. This is likely to be due to the predictive power of KS2 reading and maths SATs, which constitute 46% of the weighting in the KS4 model. In summary, this is almost certainly because there is a strong relationship between reading and maths SATs and outcomes at KS43.
Knowing that the KS2 model explains just one third of the variation between primary schools is useful. This does not mean that the ‘missing’ two thirds are explained by the school’s actions, or that making judgements about schools on outcomes is inherently unfair. It simply means that a large proportion of the differences in outcomes between primary schools are unexplained in the model.
Given the low level of predictive power at primary level, the Similar Schools model should be considered a source of investigative questions rather than evidence that a school is underperforming based on any Similar Schools data.
In summary
The Similar Schools measure is fundamental change in approach from the DfE. It recognises that school outcomes are likely to be similar where school contexts are similar. This is very different to the period when context could not be taken into account when considering school outcomes.
1 The national data in this period included measures of both attainment (raw results) and progress (accounting for starting points), although this was disrupted by the Covid 19 pandemic with no KS1 or 2 data being collected in 2020/21 and 2021/22, resulting in no primary progress measures for 20/21, 21/22, 23/24 or 24/25.
3 ‘Correlations for the vast majority of subjects are between 0.4 and 0.7 indicating a strong relationship’ https://www.cambridgeassessment.org.uk/Images/181034-exploring-the-value-of-gcse-prediction-matrices-based-upon-attainment-at-key-stage-2.pdf


Leave a Reply