

This term sees Primary schools having to get back up to speed with Progress Measures as created and used by the DfE and Ofsted. Due to the Covid pandemic and its aftermath, we’ve had almost half a decade without much discussion about them, with the focus shifting onto attendance and other areas of interest.
Most of those who have been in senior positions since the turn of the decade will remember that these measures of progress are entirely numerical, albeit with some element of judgement within the numbers which are created. Those relatively new to senior management need to getting to grips with where these numbers come from, and how they might be interpreted.
Progress in the sense of a numerical measure contrasts sharply with what most schools were encouraged to think of as progress under the 2019-2025 Ofsted Education Inspection Framework, which characterised progress as ‘knowing more (including knowing how to do more) and remembering more’. This encouraged school to ensure that students were exposed to well-sequenced, well-taught curricula.
The latest Ofsted Inspection Toolkit retains this framing of progress, requiring those assessing achievement in schools to consider ‘the progress that pupils make across the curriculum from their starting points, so that they know more, remember more and are able to do more’. The Toolkit then goes on to make a large number of interesting assumptions about how those in school might assess this progress, a subject we’ll return to later in the year.
In summary, there are two main – and competing – interpretations of progress. ‘Know and Do more’ has been in the ascendancy since the late 2010s. Numerical progress – which we did not have in 2020 & 2021 and 2024 & 2025 due to a Covid-related lack of first Key Stage 2 then Key Stage 1 data – is on its way back.
It should be noted that 2025-26 Progress Measures, which James Pembroke has been writing about in the last week (see his blogs Key Stage 2 attainment: who’s included and who isn’t?, Primary Accountability: navigating without a map and 2026 Value Added Calculator) are about to undergo yet another change as, after this year, Progress Measures will become a calculation over seven years rather than four. You can read more about this in The Return of Progress which we published in May this year.
The good thing for the Primary sector is that Secondaries don’t get their Progress Measures (Progress 8) back until next year, so it is likely that there will be little political focus on these measures for the next twelve months. This should give those who need to understand progress a chance to get up to speed before the focus on Progress ramps up again.
As well as the return of Progress Measures, we also have a new Similar Schools measure, which you can read more about in the Similar schools model for attainment: technical note. You can also see how this is reported in the Inspection Data Summary Report (IDSR),which was recently updated with the model applied to the previous three years’ data sets.
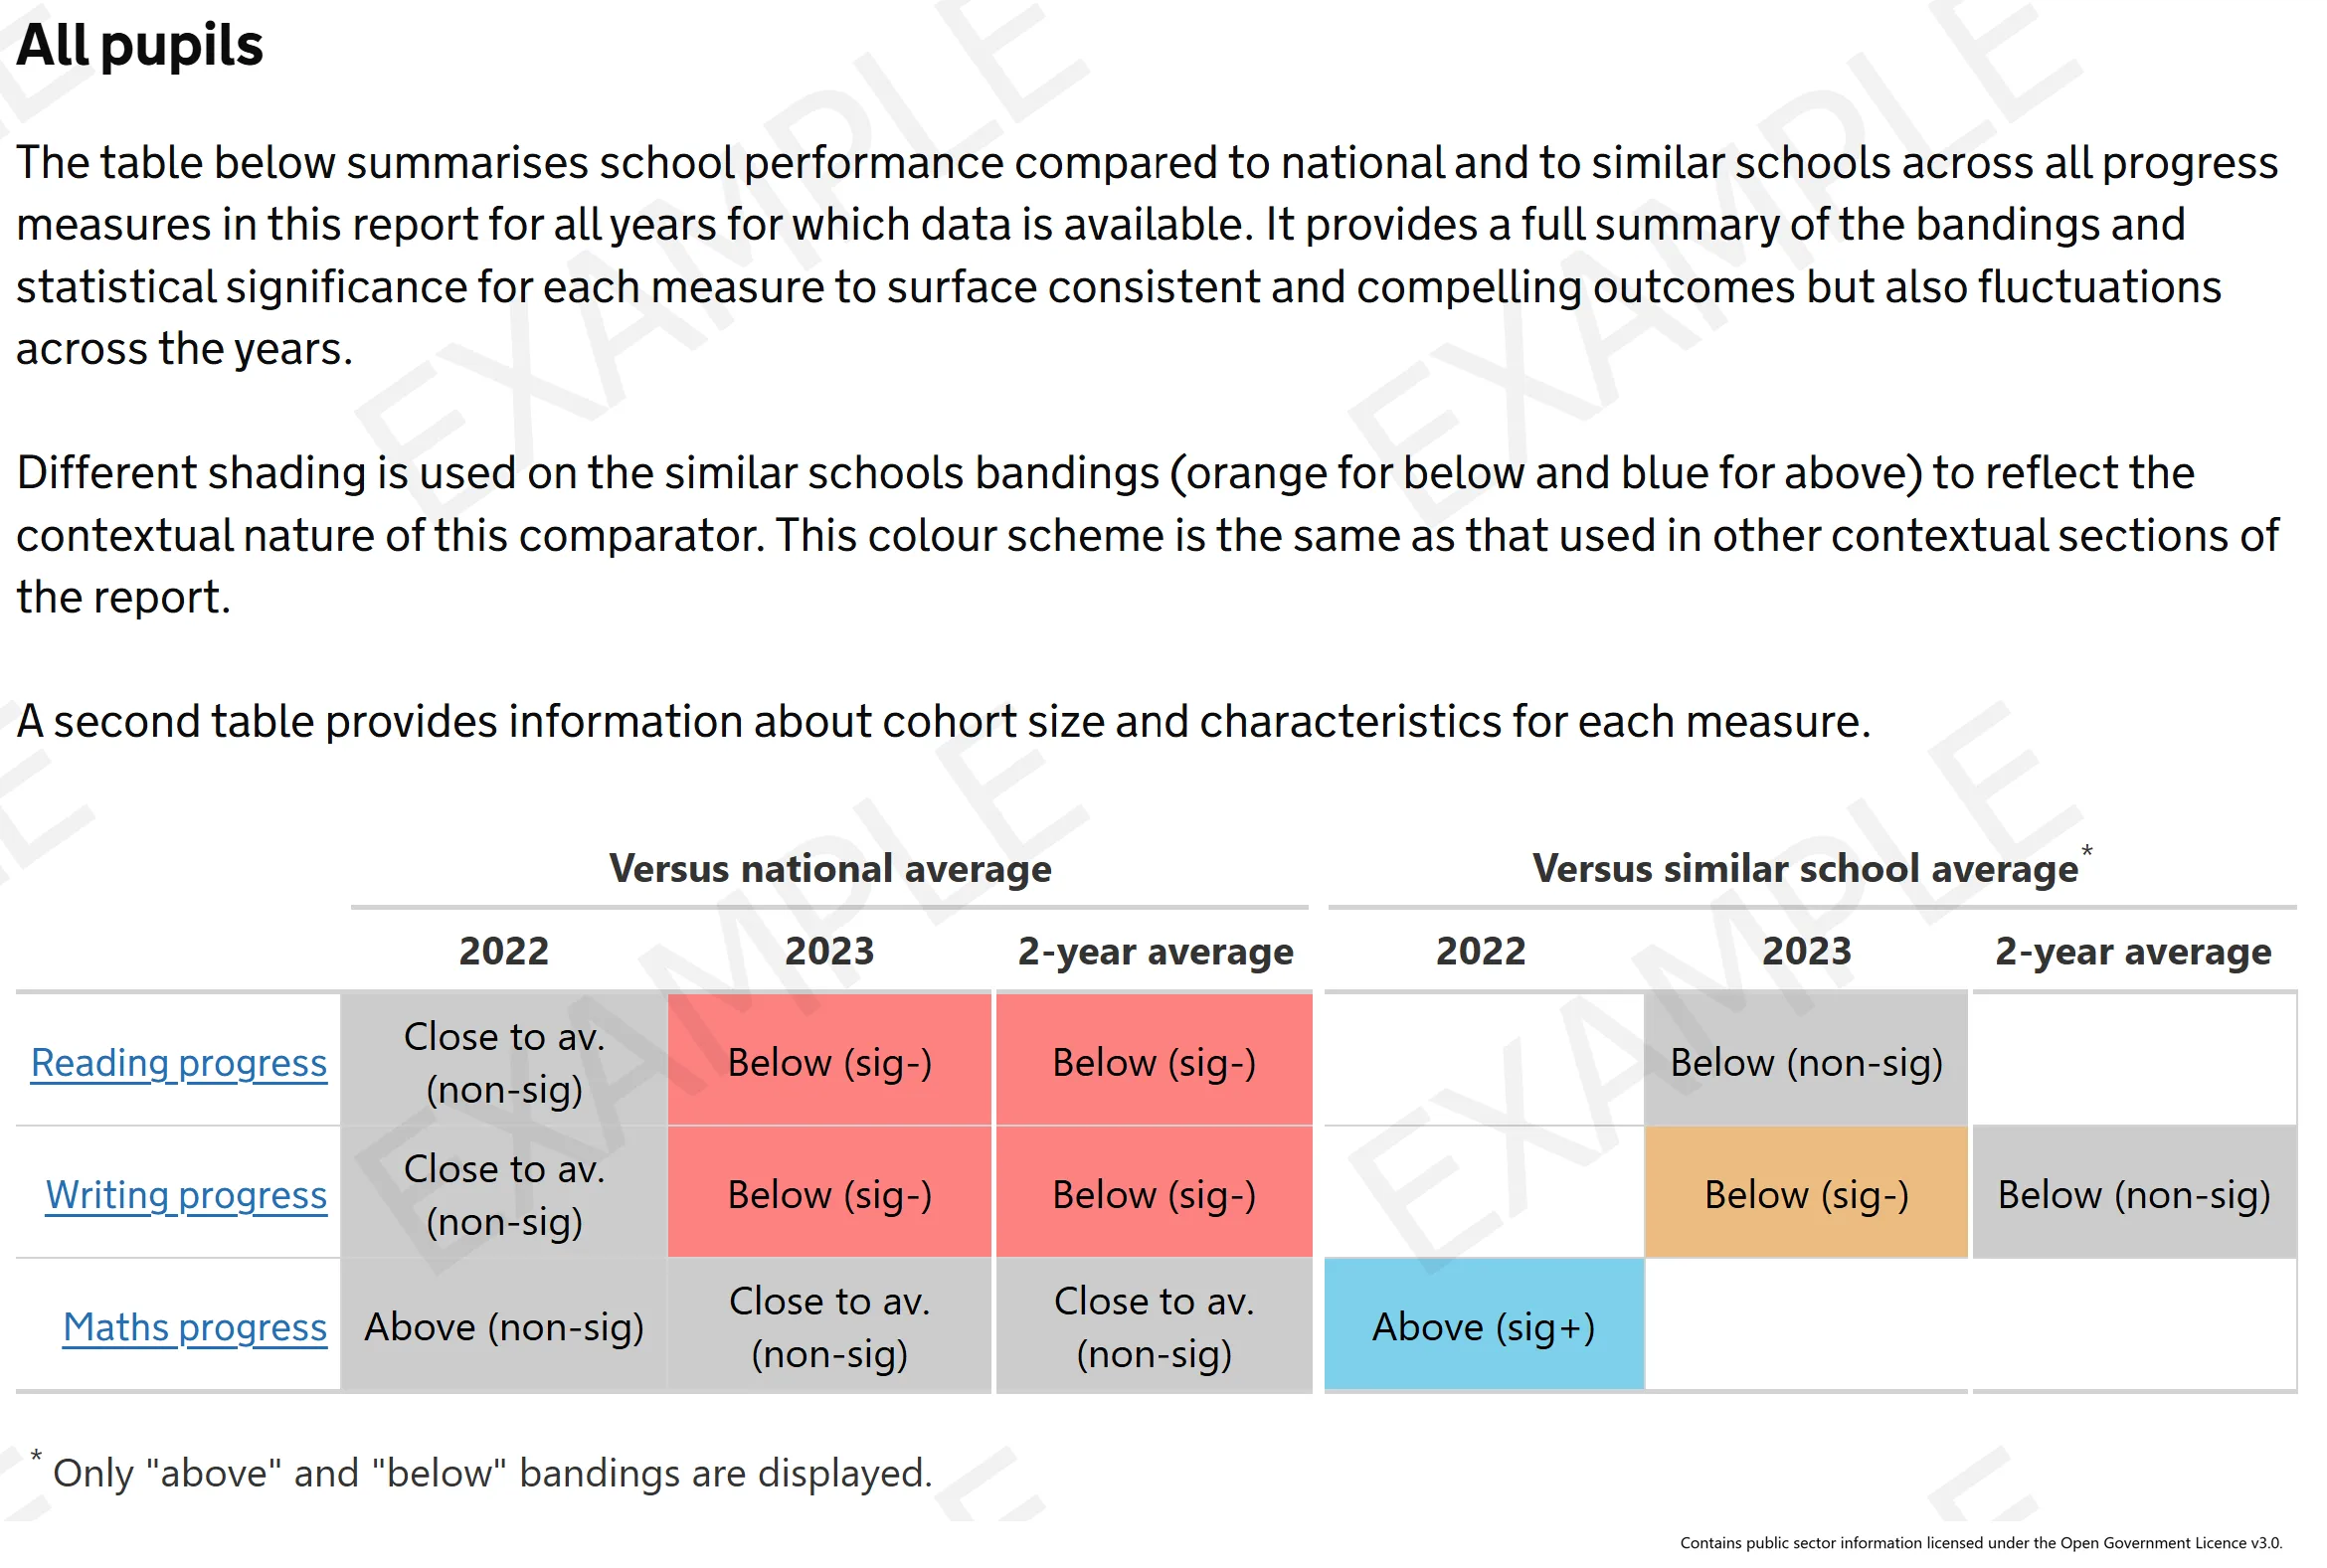
Whilst we’ll be looking more closely at the Similar Schools methodology in October in preparation for the publication of the 2025-26 IDSR later this term, here is an example of how Progress is reported for 2022 and 2023 versus national averages and a school’s bespoke similar school average from the Example Primary IDSR:
The similar schools model is an echo of the Contextual Value Added (CVA), used in 2006-2010 to compare pupils who were not only similar in terms of prior attainment but also in terms of their characteristics. As James Pembroke reports in The Return of Progress, ‘this seemed fairer but had a habit of lowering expectations for certain groups and exacerbated gaps as a consequence. CVA was ditched in 2011’.
After a few years in which it took a back seat, Progress in the numerical sense is on its way back. It’s probably time to getting up to speed with what that might mean for schools.


Leave a Reply