

Key Stage 2 Attainment Headlines were published on 16th July 2026. This was just over a week after the date on which they were due to be published, having been delayed due to issues at the company undertaking the marking process.
The DfE publishes the percentage of Year 6 pupils who reach the expected standard in Reading, Writing, Maths, as well as these percentages for the Grammar, Punctuation and Spelling test and for Science. There is also a headline Reading, Writing and Maths combined figure, which reports those pupils who have reached the expected standard in all three of these subjects. Writing and Science are teacher assessed, with the remaining three subjects being assessed via a form of standardised testing.
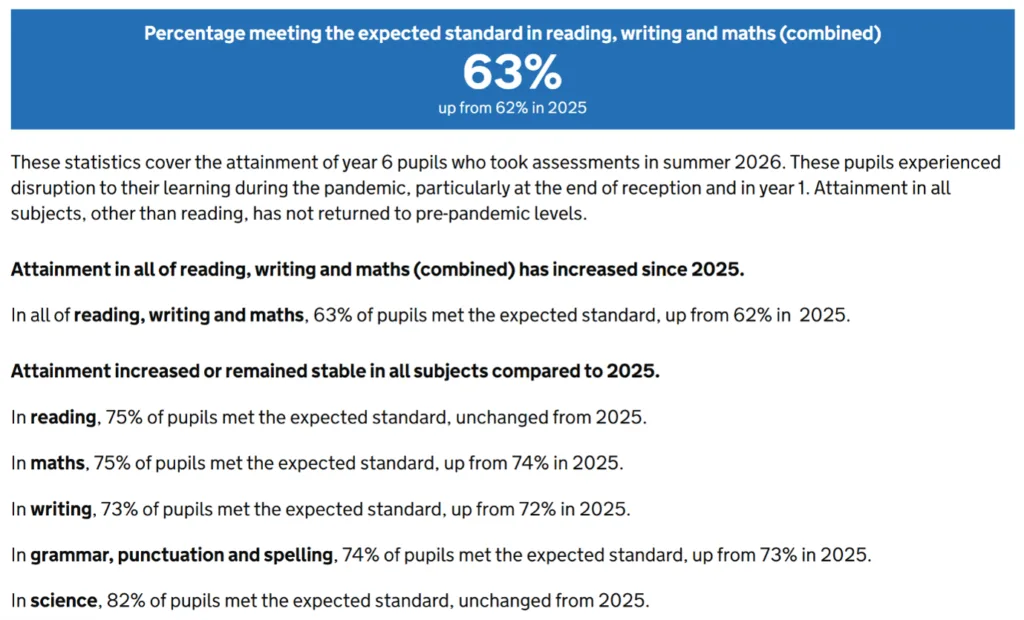
Insight estimated 73.3% of pupils met the expected standard in Writing and 83.6% of pupils met the expected standard in Science. The offical statistics has Writing at 73% and Science at 82%.
The official 2026 headline figures are as follows:
The figures since 2015/16, when the current system was introduced, are as follows:
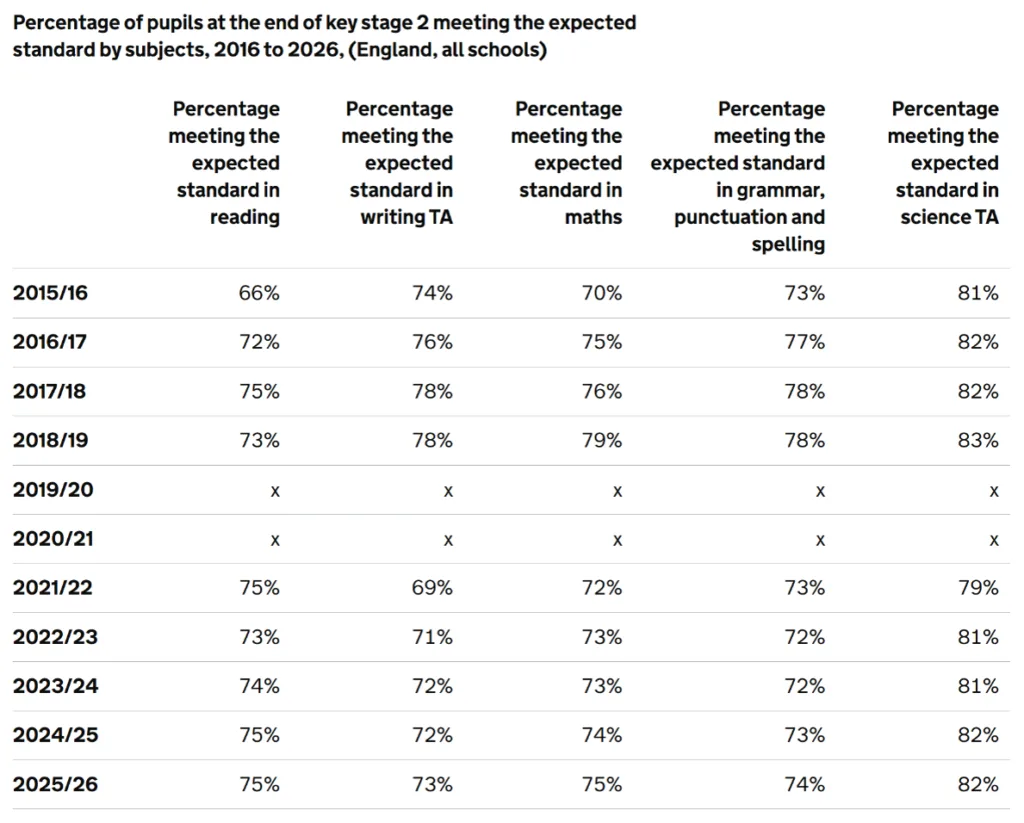
The main focus is generally on Reading and Maths, as these are used to set the baseline for the KS2-KS4 progress method in Secondary schools (the Progress 8 measure which will return next year). The combined Reading, Writing and Maths figure is also a subject of focus by the DfE in its media releases.
As we explained in our Better or Worse Than Expected blog, the expected standard in Reading and Maths is decided with reference to the outcomes of both the annual tests and the original bookmarking of the 2016 series. The system is design to maintain standards year on year, and the annual Expected Standards are set at a level which includes roughly 75% of pupils, as can been seen in the table above.
Average scaled scores have settled into a pattern of 106 for Reading and 105 for Maths, having been 105 for Reading and 104 for Maths between 2021/22 and 2023/24. GPs has been 105 since 2021/22.
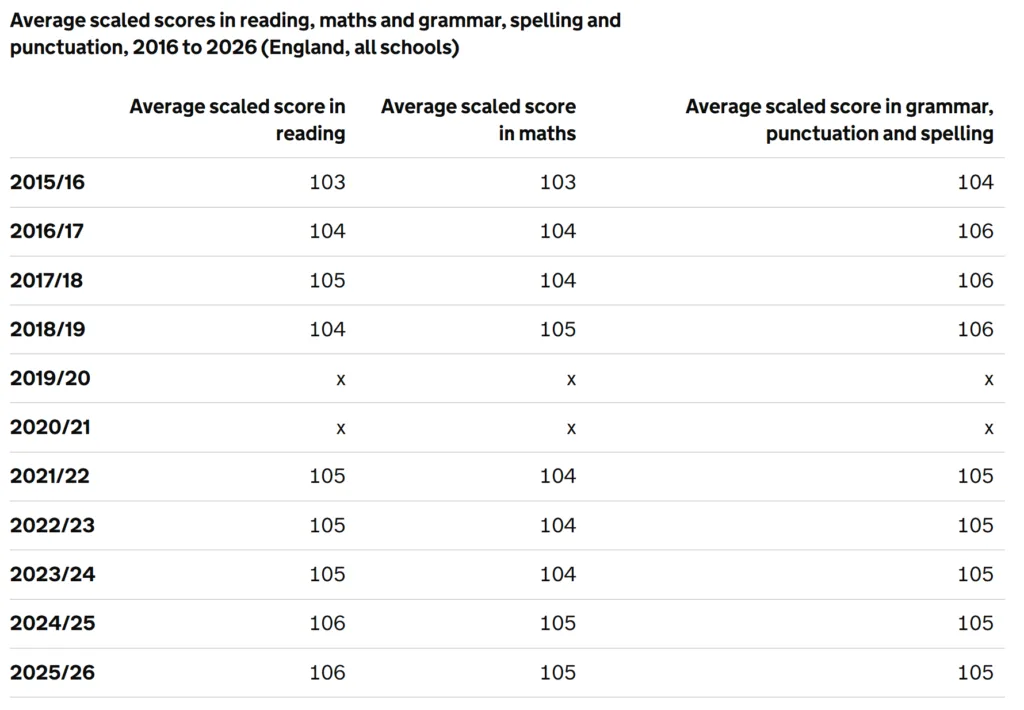
These average scaled scores do not reveal the more intriguing underlying pattern, however. As we explored in the Better or Worse Than Expected blog, since 2015-16, we appear to ‘have two distinct groups of pupils – those who are experiencing more success and those whose experience of school is likely to be much more mixed’. Essentially, those who reach the expected standard do so more comfortably than their peers in the mid-2010s; those who do not reach the expected standard in Maths appear to split into those who are getting closer to the expected standard and those who are finding it increasingly difficult to do so. In Reading, those not reaching the expected standard are finding it trickier than they did pre-pandemic.
Schools are always interested in who is included within the calculations for these statistics. Our ‘Key Stage 2 results: who’s included and who isn’t’ blog explores this.
The DfE does not publish its expanded statistics until the Autumn. Throughout the summer, we will publish further estimates based on data Insight schools have entered into our system.


Leave a Reply